Mapping Inequality
Dublin Core
Title
Mapping Inequality
Subject
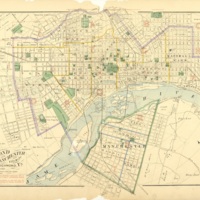
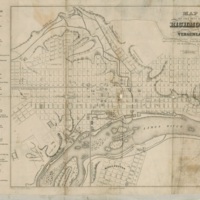
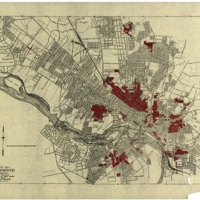
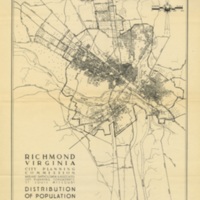
Maps of Richmond, Virginia
Description
A series of maps from 19th century to current illustrates how geography and city planning have shaped Richmond, especially around factors of poverty and race.
Creator
Library of Virginia in partnership with H.O.M.E. (Housing Opportunities Made Equal of Virginia, Inc.)
Publisher
Library of Virginia
Contributor
Brian Koziol, John Moeser, and Library of Virginia Staff
Rights
Creative Commons Attribution ShareAlike (CC BY-SA)
Collection Items
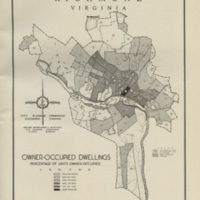
Owner-Occupied Dwellings in Richmond, Bartholomew, 1946
Increased shading represents fewer owner-occupied residences in that area.
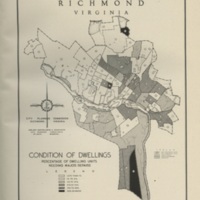
Condition of Dwellings in Richmond, Bartholomew, 1946.
Increased shading indicates increased percentage of dwelling units needing major repairs.
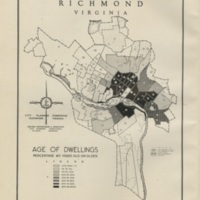
Age of Dwellings in Richmond, Bartholomew, 1946
Increased shading represents increased age of dwelling.
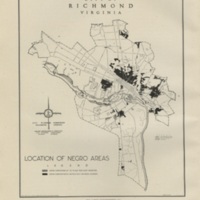
Location of Negro Areas, Bartholomew, 1946
Gray areas consisting of 25 to 60 percent Negroes, Black areas consisting of 60 percent or more Negroes.
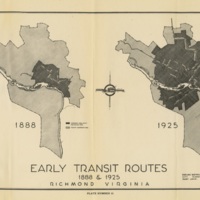
Early Transit Routes, 1888 and 1925, Bartholomew, 1943
Black area shows corporate area in 1888 and 1925. Shaded area shows corporate area in 1943.
